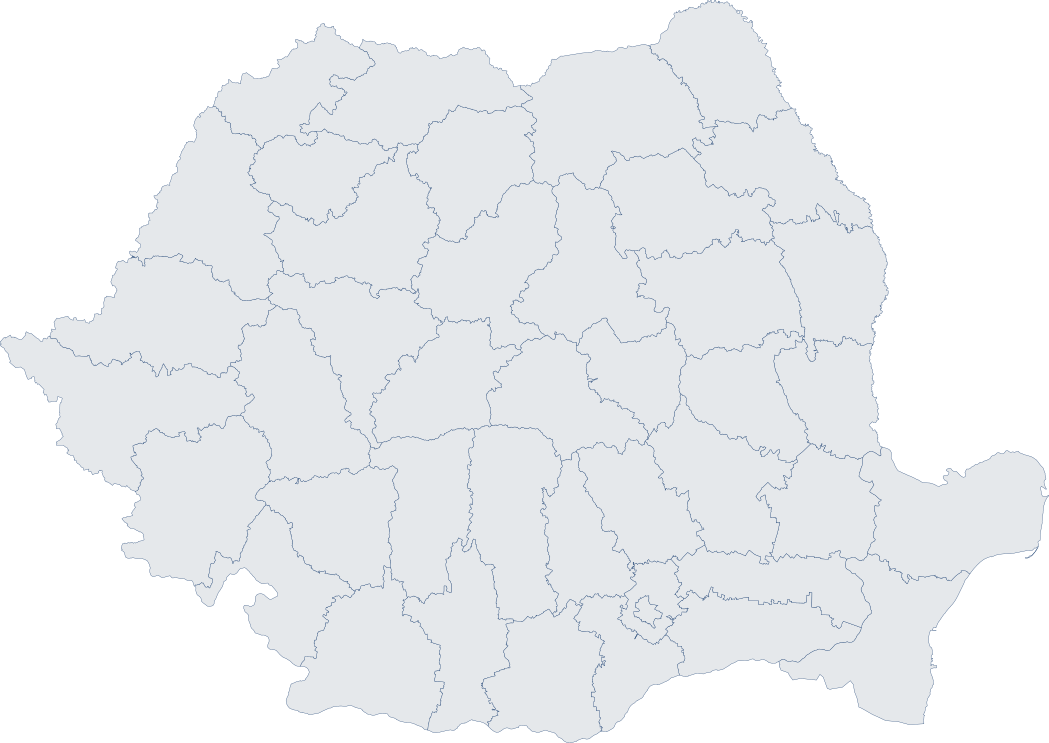
42 of 42 territories with values · Relative scale across counties in this selection · square-root spacing, anchored at zero. Colours are recalculated when the selection changes.▧ No data
Report financial filters: Constanța · CAEN 4639
Constanța · Comerț cu ridicata nespecializat de produse alimentare, băuturi și tutun · CAEN 4639 · balance sheets available for 2025
Turnover and jobs, by the companies' current registered office. Pick a county from the list to continue the analysis.
Constanța holds 3.4% of observed sales in the selected sector, with 106 companies.
Counties by turnover
Top 8 · 2025 balance sheets · share of the located-county total
18.43B RON37.9%
5B RON10.3%
3.45B RON7.1%
1.9B RON3.9%
1.81B RON3.7%
1.63B RON3.4%
1.5B RON3.1%
1.42B RON2.9%
Where the employees are
Top 8 by reported average headcount · share of the located-county total
6,87123.2%
5,31917.9%
1,4775%
1,3654.6%
1,0563.6%
1,0253.5%
9953.4%
9293.1%
/02CAEN sectors
Which sectors drive the economy?
Compare the main activities in Constanța. Open a sector for details.
In Fabricarea produselor obținute din prelucrarea țițeiului, ten companies make 100% of sales. In Transport rutier de mărfuri, only 26.2%.
SECTOR RADIOGRAPHY
Comerț cu ridicata nespecializat de produse alimentare, băuturi și tutun · Constanța
How much of a sector fits in ten companies?
Concentration extremes among the top 8 sectors by turnover · share of observed sales, not market share
Fabricarea produselor obținute din prelucrarea țițeiului100%
Transport rutier de mărfuri26.2%
40 sectors · descending orderTurnover · 2025
01
CAEN 1920
Rev.2
Fabricarea produselor obținute din prelucrarea țițeiului
Rev.3
Fabricarea produselor obținute din prelucrarea țițeiului
The main activity from the balance sheet. The name describes the code, not all of the company's authorised activities.
4 companies
17.35B RON
Turnover · 2025/2024+15.2%
4 comparable
Top 10 companies
100%
Top 10 companies
100%
02
CAEN 4621
Rev.2
Comerț cu ridicata al cerealelor, semințelor, furajelor și tutunului neprelucrat
Rev.3
Comerț cu ridicata al cerealelor, semințelor, furajelor și tutunului neprelucrat
The main activity from the balance sheet. The name describes the code, not all of the company's authorised activities.
160 companies
7.08B RON
Turnover · 2025/2024-1.8%
120 comparable
Top 10 companies
74%
Top 10 companies
74%
03
CAEN 5222
Rev.2
Activități de servicii anexe transportului pe apă
Rev.3
Activități de servicii anexe transporturilor pe apă
The definitions differ between revisions. Figures are grouped by the code reported in the balance sheet; each company's revision is not confirmed.
241 companies
2.72B RON
Turnover · 2025/2024-14%
202 comparable
Top 10 companies
74.4%
Top 10 companies
74.4%
04
CAEN 0111
Rev.2
Cultivarea cerealelor (exclusiv orez), plantelor leguminoase și a plantelor producătoare de semințe oleaginoase
Rev.3
Cultivarea cerealelor (excluzând orezul), plantelor leguminoase și a plantelor oleaginoase
The definitions differ between revisions. Figures are grouped by the code reported in the balance sheet; each company's revision is not confirmed.
685 companies
2.68B RON
Turnover · 2025/2024+14.2%
621 comparable
Top 10 companies
45.5%
Top 10 companies
45.5%
05
CAEN 4941
Rev.2
Transporturi rutiere de mărfuri
Rev.3
Transporturi rutiere de mărfuri
The main activity from the balance sheet. The name describes the code, not all of the company's authorised activities.
1,569 companies
2.2B RON
Turnover · 2025/2024+9.2%
1,231 comparable
Top 10 companies
26.2%
Top 10 companies
26.2%
06
CAEN 5224
Rev.2
Manipulări
Rev.3
Manipulări
The main activity from the balance sheet. The name describes the code, not all of the company's authorised activities.
53 companies
2.2B RON
Turnover · 2025/2024-5.2%
46 comparable
Top 10 companies
81.5%
Top 10 companies
81.5%
07
CAEN 4711
Rev.2
Comerț cu amănuntul în magazine nespecializate, cu vânzare predominantă de produse alimentare, băuturi și tutun
Rev.3
Comerț cu amănuntul nespecializat, cu vânzare predominantă de produse alimentare, băuturi și tutun
The definitions differ between revisions. Figures are grouped by the code reported in the balance sheet; each company's revision is not confirmed.
1,663 companies
2.09B RON
Turnover · 2025/2024+4%
1,294 comparable
Top 10 companies
29.1%
Top 10 companies
29.1%
08
CAEN 4690
Rev.2
Comerț cu ridicata nespecializat
Rev.3
Comerț cu ridicata nespecializat
The main activity from the balance sheet. The name describes the code, not all of the company's authorised activities.
303 companies
1.84B RON
Turnover · 2025/2024+9.3%
235 comparable
Top 10 companies
70.8%
Top 10 companies
70.8%
09
CAEN 4639
Rev.2
Comerț cu ridicata nespecializat de produse alimentare, băuturi și tutun
Rev.3
Comerț cu ridicata nespecializat de produse alimentare, băuturi și tutun
The main activity from the balance sheet. The name describes the code, not all of the company's authorised activities.
106 companies
1.63B RON
Turnover · 2025/2024+7.4%
73 comparable
Top 10 companies
86.9%
Top 10 companies
86.9%
10
CAEN 5210
Rev.2
Depozitări
Rev.3
Depozitări
The main activity from the balance sheet. The name describes the code, not all of the company's authorised activities.
43 companies
1.5B RON
Turnover · 2025/2024+408.6%
31 comparable
Top 10 companies
99.2%
Top 10 companies
99.2%
One company, one main code. Growth uses the same companies in both years; missing values remain "—". CAEN definitions sit next to each name.
/03Performance
What the typical company looks like
Beyond the giants: sales and margin of the company in the middle of the distribution.
The typical company sells 717.17K RON a year and keeps 3.6% of sales as net profit.
Median turnover
717.17K RON
99 values available
Median net margin
3.6%
74 eligible companies
Aggregate net margin
2.4%
Cumulative profit / cumulative sales, same companies
Profitable companies
51.9%
55 of 106 with a known result
National median · CAEN 4639
2.6%
Same activity, all of Romania
Distribution of net margins
Companies by margin band · net profit / positive turnover
Loss2027%
Zero result00%
Above 0–2%1216.2%
Above 2–5%1520.3%
Above 5–10%1418.9%
Above 10%1317.6%
74 companies with a known profit and positive sales; 32 excluded. Bands describe margins, not bankruptcy risk.
/04Change
Who grew. Who shrank.
Same companies, two years. Compare the change in sales with the change in jobs.
47.9% of the 73 comparable companies sold more in 2025 than in 2024.
Cumulative turnover
+7.4%
73 companies with turnover in both years
Median turnover change
+1.1%
Only companies with a positive 2024 baseline
Number of employees
-4.9%
65 companies with employees reported in both years
More sales or fewer?
Number of companies with comparable data, split by direction of change
Growth3547.9%
Decline3547.9%
No change34.1%
Nominal changes in RON, not adjusted for inflation. Companies without data in one of the years are not compared.
/05Dynamics
Company dynamics, county by county
Growth, survival, concentration, the trade register and state dependence in 2025: the national figure and the counties at both ends, for every map layer.
How much business grew on last year
Turnover change at the same companies · % vs 2025−1
The same aggregates as on the map, also available as tables, with a stable citation for every version.
Analysis: DemoANAF.ro · Constanța · CAEN 4639.
In Constanța, the 2025 report covers 106 companies with available indicators (CAEN 4639). This is the observed sample, not the number of all registered companies.
The median net margin is 3.6% in 2025, computed for 74 companies with positive sales and a known net result, including loss-making companies. 32 companies do not meet these conditions.
12 companies have strictly positive margins of at most 2% (16.2% of eligible companies). 20 eligible companies have negative margins.
55 of 106 companies with a known net result are profitable: 51.9%. The cumulative net result, after subtracting losses, is 39.59M RON.
The cumulative turnover of the 73 comparable companies changed by +7.4% between 2024 and 2025, in nominal RON.
Counties · 43
Counties · 2025 balance sheets · values in RON · unknown values are marked "—".
National series independent of CAEN: initiation notices published in 2025, by the authority's current office. Values are estimates, not payments.
Notices and estimated values, 2025
Territory / activity
Notices
Value (RON)
Brașov
834
5.85B RON
Ialomița
180
1.07B RON
Iași
1,086
14.34B RON
Tulcea
177
1.17B RON
Mehedinți
187
918.76M RON
Vâlcea
384
2.27B RON
Mureș
740
8.41B RON
București
6,659
146.69B RON
Bacău
429
2.57B RON
Maramureș
371
2.83B RON
Botoșani
321
1.32B RON
Brăila
358
1.49B RON
Galați
577
5.68B RON
Dâmbovița
367
3.11B RON
Caraș-Severin
241
1.42B RON
Hunedoara
482
2.3B RON
Prahova
552
4.43B RON
Călărași
174
765.83M RON
Ilfov
553
6.78B RON
Constanța
757
7.24B RON
Bihor
658
4.49B RON
Sibiu
908
5.72B RON
Timiș
915
8.62B RON
Olt
304
1.2B RON
Cluj
1,484
15.53B RON
Vaslui
366
1.65B RON
Giurgiu
171
1.94B RON
Neamț
346
1.76B RON
Gorj
601
3.25B RON
Sălaj
265
1.1B RON
Alba
359
1.58B RON
Suceava
567
3.91B RON
Argeș
532
2.2B RON
Dolj
661
13.33B RON
Bistrița-Năsăud
272
1.71B RON
Teleorman
229
1.58B RON
Arad
386
3.25B RON
Buzău
278
1.02B RON
Vrancea
277
3.31B RON
Covasna
255
1.01B RON
Harghita
333
2.68B RON
Satu Mare
291
2.55B RON
Județ necunoscut
22
21.89M RON
UAT Mangalia
44
81.62M RON
UAT Mihail Kogălniceanu
5
20.84M RON
UAT Constanța
506
5.36B RON
UAT Medgidia
19
152.61M RON
UAT Agigea
20
170.72M RON
UAT Năvodari
2
7.27M RON
UAT Dobromir
1
1.04M RON
UAT Cobadin
1
161.88M RON
UAT Nicolae Bălcescu
1
498.74K RON
UAT Cernavodă
12
23.99M RON
UAT Crucea
4
13.47M RON
Cite the report
Computed on 9/18/2026, 8:47:03 PM · version 20260918174703963. Annual data may be revised when new balance sheets arrive.
DemoANAF.ro. Romania business report 2025 — Constanța, CAEN 4639. Version 20260918174703963, computed on 2026-09-18T17:47:03.963Z. https://demoanaf.ro/en/raport-afaceri-romania-2025?judet=Constan%C8%9Ba&caen=4639#date-raport Data: https://demoanaf.ro/rapoarte/afaceri-romania-2025/date.csv?rev=20260918174703963
SRL, SRL-D and SA registrations observed in Romania. National series, independent of the financial filters.
Most new companies appeared in July: 10,734 observed registrations.
Pace of registrations
Earliest available registration for each CUI · coverage not confirmed
Solid line: 2025
See the monthly data
Month
2025
Jan
6,313
Feb
8,206
Mar
8,589
Apr
7,449
May
8,145
Jun
7,682
Jul
10,734
Aug
7,697
Sep
9,208
Oct
9,472
Nov
9,682
Dec
7,334
Coverage not confirmed: differences between series may reflect missing data. Months without observations do not mean zero.
/08Procurement
Companies and public procurement
Pace of distinct contracts recorded in SEAP. National series, by contract date.
The month with the most SEAP contracts was April: 12,765 distinct contracts.
Contracts recorded in SEAP
A contract's lots and suppliers are not counted as separate contracts
Solid line: 2025
See the monthly data
Month
2025
Jan
10,684
Feb
9,665
Mar
11,690
Apr
12,765
May
11,213
Jun
9,725
Jul
9,714
Aug
9,094
Sep
9,436
Oct
12,761
Nov
12,032
Dec
9,769
Period coverage is not confirmed. We count contracts, not payments; awarded values are not actual spending.
/09Methodology
What we measure and what stays unknown
Every percentage must have a clear population, a period and a source.
Balance sheets and coverage
We analyse companies with financial indicators available for 2025. This is not a census of all companies and does not implicitly cover only SRL/SA. The coverage of each indicator is shown separately.
Year-on-year comparisons
Annual balance sheets do not measure H1 2026 results. Companies are linked by CUI. We compare only values available in both years. Geographic and CAEN groups are those of the 2025 cohort; we do not measure relocations or sector changes.
CAEN classification
We use the main code from the balance sheet, normalised to four digits. Authorised activities are not summed. Short titles describe the activities; the exact Rev.2 and Rev.3 definitions sit next to each code. Where they differ, both are shown, without assuming the company's revision or historical equivalence.
Missing values and rates
A missing value stays unknown. Margins require positive turnover and a known net result, including losses. The median treats every company equally. The aggregate margin uses the sums of profit and sales for exactly the same eligible companies. The bands are: below 0%, exactly 0%, above 0% up to and including 2%, above 2% up to and including 5%, above 5% up to and including 10%, and above 10%. They are not solvency thresholds. Growth rates are undefined when the baseline is zero or negative.
The map: capital, employees and tenders
Capital means equity (I10), including negative values, not turnover or share capital. Employees are the reported annual averages, attributed to the current office; the per-company average uses only companies with this indicator known. Tenders are initiation notices published in 2025, located by the authority's current office. Values are estimates, not payments. Colours use fixed numeric references, not ranks or quartiles. Margins have references at −10%, 0%, 2%, 5%, 10% and 20%; extreme values keep the exact number but saturate the colour. Totals use a logarithmic magnitude scale with references in the indicator's units. Each territory has a single observed value; we do not interpolate between localities. The same value keeps the same colour when the county, local unit or CAEN changes. Hatched areas have no values available. Local-unit boundaries come from ANCPI, processed by geo-spatial.org (2025). Localities are linked to local units through the INS SIRUTA 2025 nomenclature. Ambiguous addresses stay in the county total; local units use references adapted to local magnitude, constant across counties and years.
Currencies and exchange rates
All amounts are reported in RON. Conversion to EUR uses the annual average rate published by BNR for the report year; for USD, and for years without a published average, we use the arithmetic mean of the European Central Bank's daily reference rates. Today's rate is never used. It is an indicative conversion for comparison, not an accounting revaluation.
Updates
The report is recomputed periodically from the available data. The generation date does not prove the source is complete. Changes to balance sheets may revise this edition's results.